

NYU Crime Log Visualization is a personal data-visualization project I built to better understand patterns behind publicly available NYU campus safety reports. Instead of treating each incident as an isolated event, I wanted to see how location, time, and type of incident interact over longer periods.
The project combines data analysis with interactive storytelling. Using D3.js and Three.js, I translated raw crime logs into charts and a 3D campus map, allowing viewers to explore trends across different campuses and time ranges.
This is an unofficial, non-commercial student project, created both as a design experiment and as a way to think more critically about how data presentation can influence our perception of safety.
NYU is a university embedded in the middle of a dense urban environment, where campus safety is closely tied to the surrounding city. While NYU publicly releases its crime log data, the information is presented mostly as raw text and tables, making it difficult for students to quickly understand patterns, trends, or context.
As a student, I found it hard to answer simple but important questions—where incidents happen most often, how crime types differ across campuses, or how things change over time. This gap between available data and actual understanding led me to explore a more intuitive way of presenting campus safety information.
Data Collection & Automation
I built a lightweight web crawler to automatically fetch and update NYU’s publicly available crime log data from the university website, converting raw records into structured CSV files. This allowed the project to stay up to date without manual data entry and made the dataset easier to analyze and visualize.
Data Normalization & Spatial Mapping
One major challenge was inconsistent building names across the raw data. I created a matching system using a custom CSV to map variations in building names to their correct campus buildings and corresponding 3D models. This step made it possible to accurately link each incident to a physical location on the campus map.

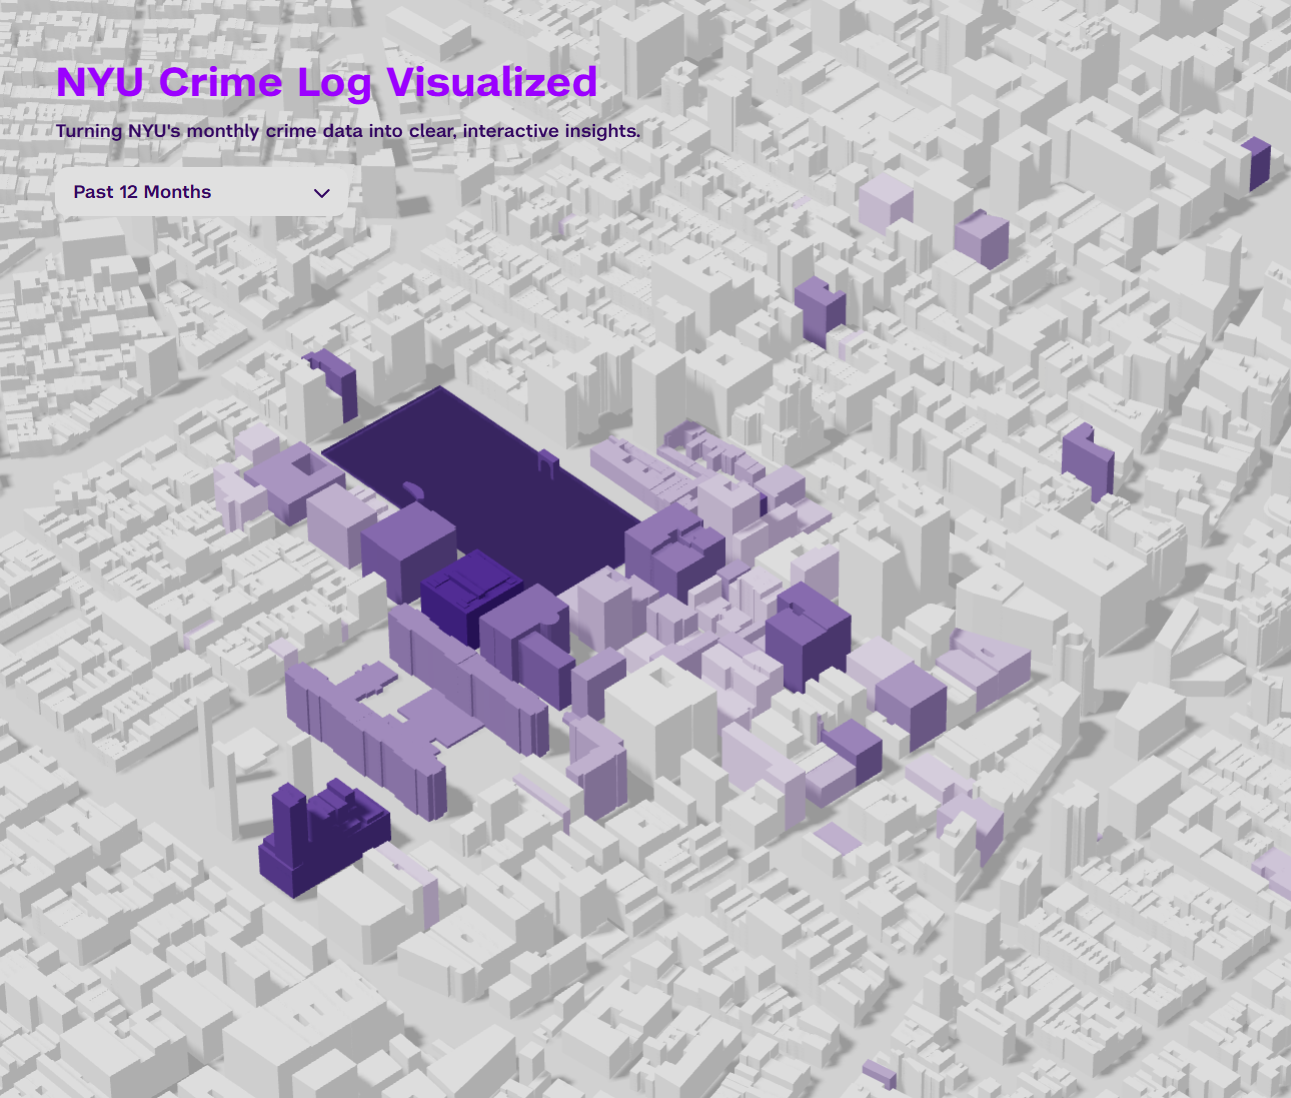
Visualization & Interaction Design
I implemented the 3D campus environment using Three.js and designed the charts and page layout in Figma before translating them into interactive visuals with D3.js. The focus was on clarity and exploration—allowing users to move between spatial and temporal views while keeping the interface lightweight and readable.

Once the data was visualized spatially and across different time ranges, several consistent patterns emerged.
As a student navigating campus every day, I wanted a clearer way to understand the environment around me. This project grew from that curiosity. By visualizing crime data in a more intuitive format, it became easier to see patterns that are otherwise buried in text—and to think more critically about how information shapes our sense of safety.